Debugging Like a Pro: Mastering the Console
Effective debugging is a cornerstone of efficient web development. Web IDE's integrated console provides powerful tools to inspect your JavaScript, catch errors, and understand the flow of your application without leaving your mobile device.
Accessing the Console
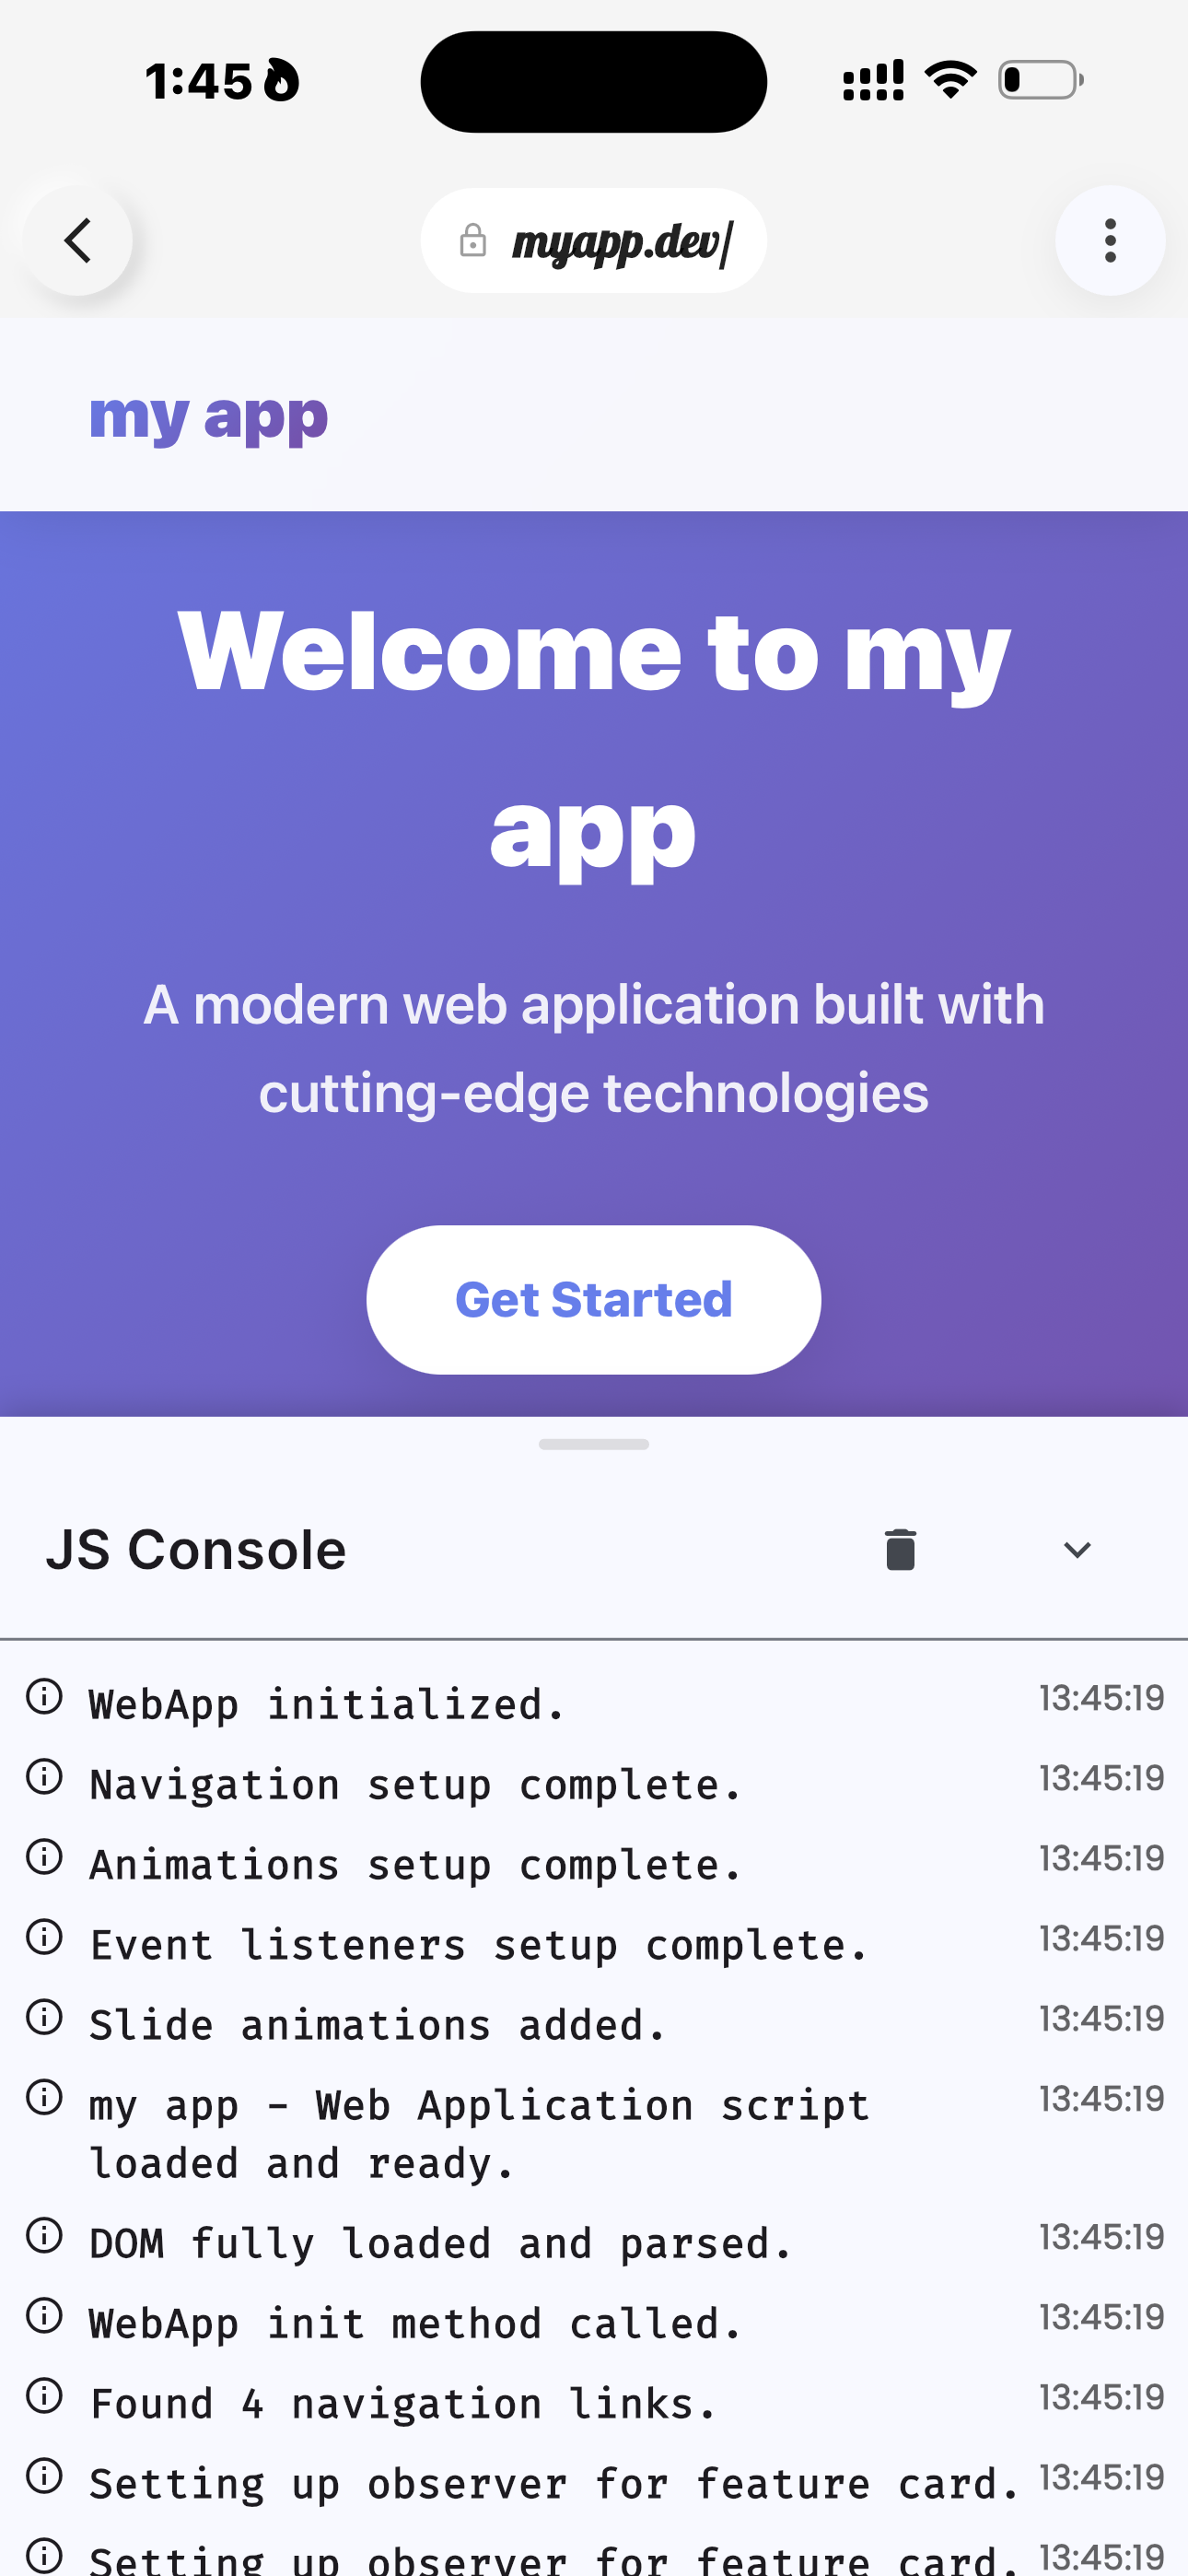
While in Live Preview mode, simply tap the Terminal Icon to reveal the console panel. Here, you'll see all messages logged from your JavaScript code, as well as any runtime errors or warnings from the browser environment.
Using console.log() and Friends
Beyond basic console.log(), explore other methods for more structured debugging:
console.warn(): For non-critical issues that should still be addressed.console.error(): To highlight critical errors.console.info(): For general informational messages.console.table(): To display array or object data in a clear, tabular format.
// Example: Using console.table for structured data
const users = [
    { id: 1, name: 'Alice', email: 'alice@example.com' },
    { id: 2, name: 'Bob', email: 'bob@example.com' }
];
console.table(users);
Understanding Error Messages
The console not only shows errors but also provides stack traces, indicating exactly where an error occurred (file name, line number, and column). Learning to read these traces is crucial for quickly pinpointing the source of a bug. Don't be intimidated by red text – it's your guide to fixing issues!